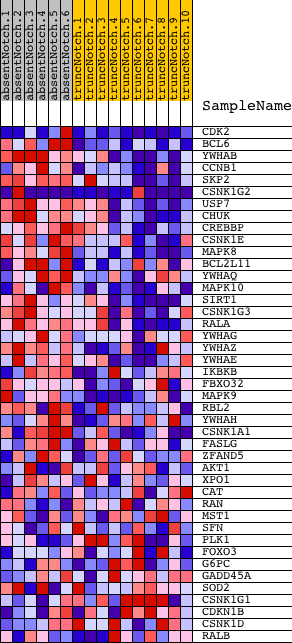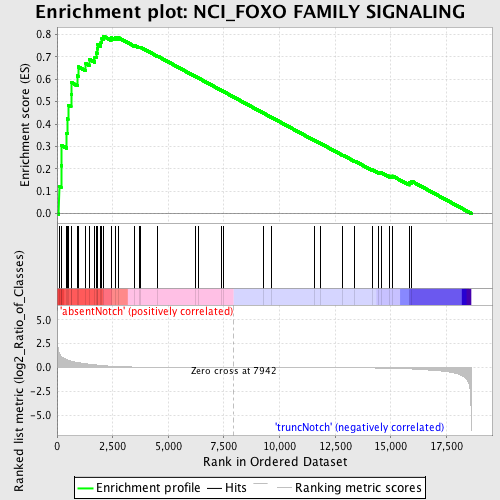
Profile of the Running ES Score & Positions of GeneSet Members on the Rank Ordered List
| Dataset | Set_03_absentNotch_versus_truncNotch.phenotype_absentNotch_versus_truncNotch.cls #absentNotch_versus_truncNotch.phenotype_absentNotch_versus_truncNotch.cls #absentNotch_versus_truncNotch_repos |
| Phenotype | phenotype_absentNotch_versus_truncNotch.cls#absentNotch_versus_truncNotch_repos |
| Upregulated in class | absentNotch |
| GeneSet | NCI_FOXO FAMILY SIGNALING |
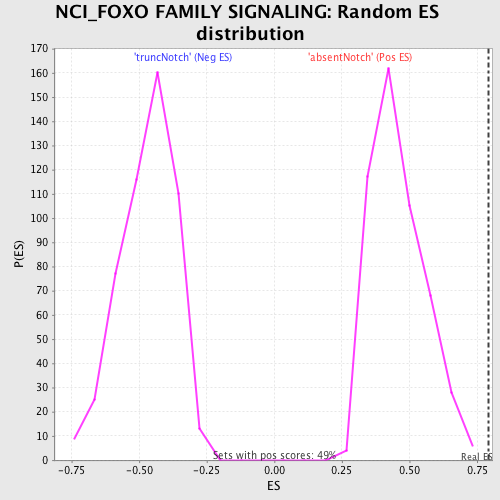
| Enrichment Score (ES) | 0.7929157 |
| Normalized Enrichment Score (NES) | 1.7367958 |
| Nominal p-value | 0.0 |
| FDR q-value | 0.045974813 |
| FWER p-Value | 0.037 |
| PROBE | DESCRIPTION (from dataset) | GENE SYMBOL | GENE_TITLE | RANK IN GENE LIST | RANK METRIC SCORE | RUNNING ES | CORE ENRICHMENT | |
|---|---|---|---|---|---|---|---|---|
| 1 | CDK2 | 130484 2260301 4010088 5050110 | 84 | 1.554 | 0.1226 | Yes | ||
| 2 | BCL6 | 940100 | 181 | 1.170 | 0.2131 | Yes | ||
| 3 | YWHAB | 1740176 | 201 | 1.126 | 0.3042 | Yes | ||
| 4 | CCNB1 | 4590433 4780372 | 427 | 0.824 | 0.3595 | Yes | ||
| 5 | SKP2 | 360711 380093 4810368 | 459 | 0.799 | 0.4232 | Yes | ||
| 6 | CSNK1G2 | 3060095 4730037 | 492 | 0.763 | 0.4839 | Yes | ||
| 7 | USP7 | 3990356 | 626 | 0.675 | 0.5319 | Yes | ||
| 8 | CHUK | 7050736 | 646 | 0.662 | 0.5850 | Yes | ||
| 9 | CREBBP | 5690035 7040050 | 909 | 0.541 | 0.6152 | Yes | ||
| 10 | CSNK1E | 2850347 5050093 6110301 | 951 | 0.518 | 0.6553 | Yes | ||
| 11 | MAPK8 | 2640195 | 1291 | 0.395 | 0.6693 | Yes | ||
| 12 | BCL2L11 | 780044 4200601 | 1444 | 0.349 | 0.6897 | Yes | ||
| 13 | YWHAQ | 6760524 | 1695 | 0.282 | 0.6993 | Yes | ||
| 14 | MAPK10 | 6110193 | 1760 | 0.267 | 0.7177 | Yes | ||
| 15 | SIRT1 | 1190731 | 1801 | 0.257 | 0.7365 | Yes | ||
| 16 | CSNK1G3 | 110450 | 1826 | 0.251 | 0.7558 | Yes | ||
| 17 | RALA | 2680471 | 1969 | 0.218 | 0.7660 | Yes | ||
| 18 | YWHAG | 3780341 | 2010 | 0.207 | 0.7808 | Yes | ||
| 19 | YWHAZ | 1230717 | 2082 | 0.195 | 0.7929 | Yes | ||
| 20 | YWHAE | 5310435 | 2426 | 0.138 | 0.7857 | No | ||
| 21 | IKBKB | 6840072 | 2604 | 0.118 | 0.7858 | No | ||
| 22 | FBXO32 | 110037 610750 | 2754 | 0.101 | 0.7861 | No | ||
| 23 | MAPK9 | 2060273 3780209 4070397 | 3467 | 0.051 | 0.7519 | No | ||
| 24 | RBL2 | 580446 1400670 | 3687 | 0.040 | 0.7434 | No | ||
| 25 | YWHAH | 1660133 2810053 | 3745 | 0.038 | 0.7434 | No | ||
| 26 | CSNK1A1 | 2340427 | 4528 | 0.017 | 0.7027 | No | ||
| 27 | FASLG | 2810044 | 6203 | 0.005 | 0.6130 | No | ||
| 28 | ZFAND5 | 6770673 | 6353 | 0.005 | 0.6053 | No | ||
| 29 | AKT1 | 5290746 | 7384 | 0.001 | 0.5500 | No | ||
| 30 | XPO1 | 540707 | 7497 | 0.001 | 0.5441 | No | ||
| 31 | CAT | 4280152 | 9278 | -0.003 | 0.4485 | No | ||
| 32 | RAN | 2260446 4590647 | 9627 | -0.004 | 0.4301 | No | ||
| 33 | MST1 | 1400403 | 11580 | -0.011 | 0.3260 | No | ||
| 34 | SFN | 6290301 7510608 | 11843 | -0.013 | 0.3129 | No | ||
| 35 | PLK1 | 1780369 2640121 | 12849 | -0.021 | 0.2606 | No | ||
| 36 | FOXO3 | 2510484 4480451 | 13380 | -0.028 | 0.2343 | No | ||
| 37 | G6PC | 430093 | 14155 | -0.043 | 0.1961 | No | ||
| 38 | GADD45A | 2900717 | 14464 | -0.051 | 0.1837 | No | ||
| 39 | SOD2 | 1410053 | 14581 | -0.055 | 0.1820 | No | ||
| 40 | CSNK1G1 | 840082 1230575 3940647 | 14956 | -0.069 | 0.1676 | No | ||
| 41 | CDKN1B | 3800025 6450044 | 15072 | -0.076 | 0.1676 | No | ||
| 42 | CSNK1D | 4280280 4480167 6450600 | 15821 | -0.134 | 0.1383 | No | ||
| 43 | RALB | 6130397 | 15935 | -0.149 | 0.1443 | No |